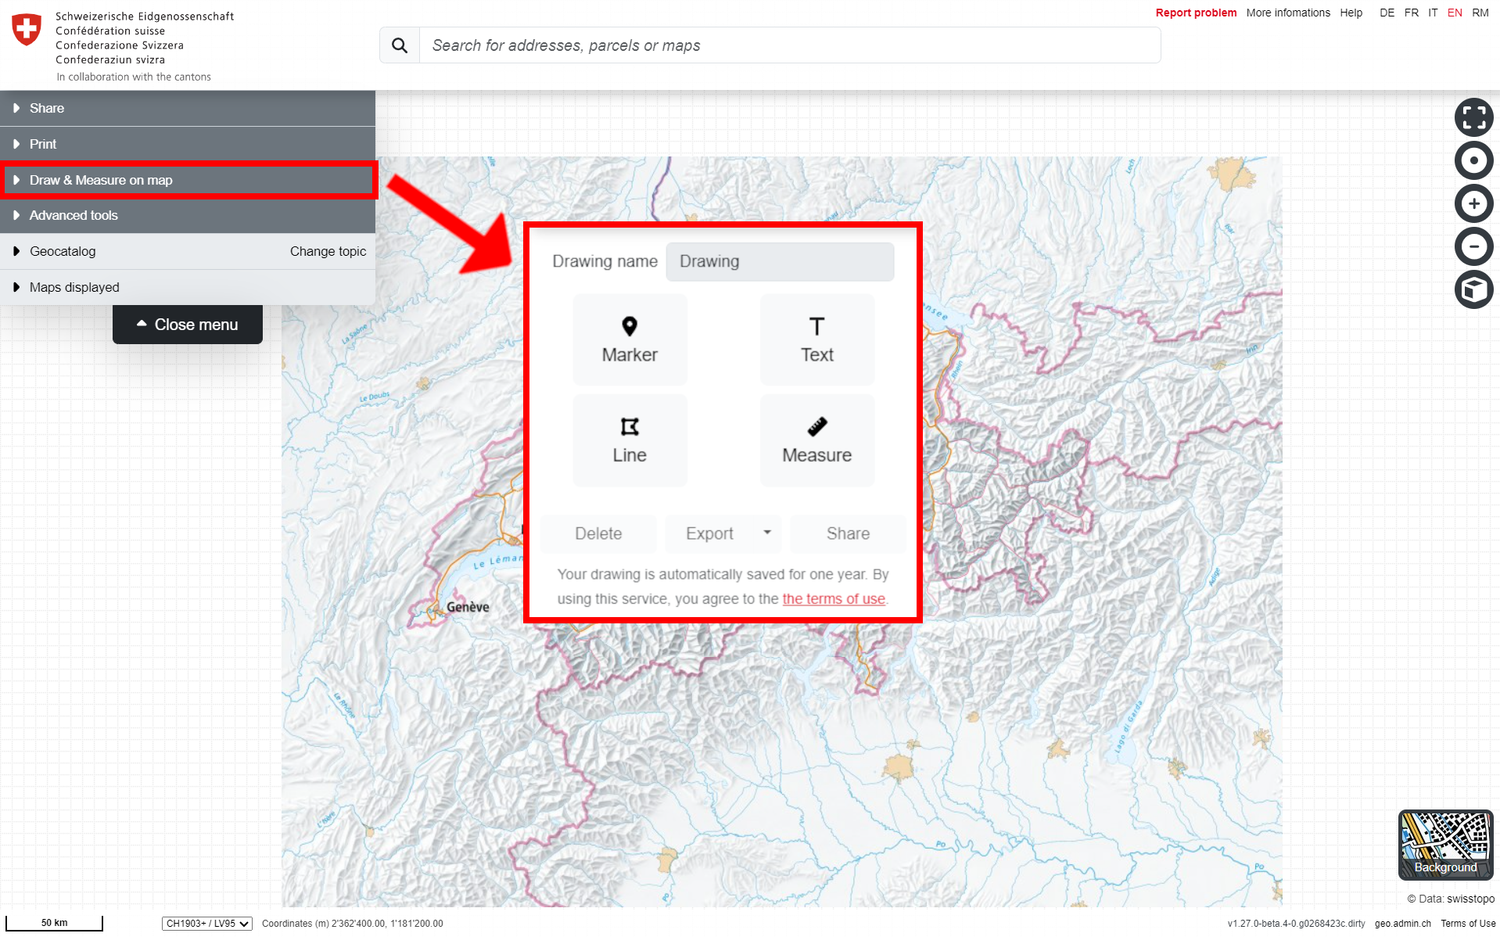
If you open this third tab at the top left of the menu, the map viewer switches to "Draw & Measure" mode and the various tools appear at the top left, the use of which is explained below. Back to the main help page
Above the drawing options, you have the option to name your drawing and thus your future KML or GPX file as it suits you. Attention: You can only change the name if you have made at least one edit to your drawing.
Adding a symbol
Select the "Marker" option. You can then click to place a marker symbol at the desired location on the map. This step can be repeated for any number of marker symbols.
Once the symbol has been placed, you can adjust the following properties in the associated pop-up window (which can also be arranged in the lower part of the map view using the triangle icon at the top right):
Text: A short text can be entered here, which is assigned to the symbol on the map. The ‹A› icon at the bottom right of the pop-up can be used to adjust the size and text colour, as well as the position of the text, as shown at the image in the bottom.
Description: A longer text describing the dot symbol can be entered here. Users of the drawing can view this text as "Object information" by clicking on the dot symbol. This input field also supports HTML coded texts. Additional elements can also be added to the description: a link (description and URL), a link to a photo or video. This is done using the three icons on the right above the description field.
The exact coordinates of the point symbol are given below the description in CH1903+/LV95 and can be copied as required.
Size, signature type and colour: the marker size, signature and colour can be adjusted using the "drop" icon at the bottom right of the pop-up.
Delete: The marker symbol can be deleted by pressing the "recycle bin" icon at the bottom right.
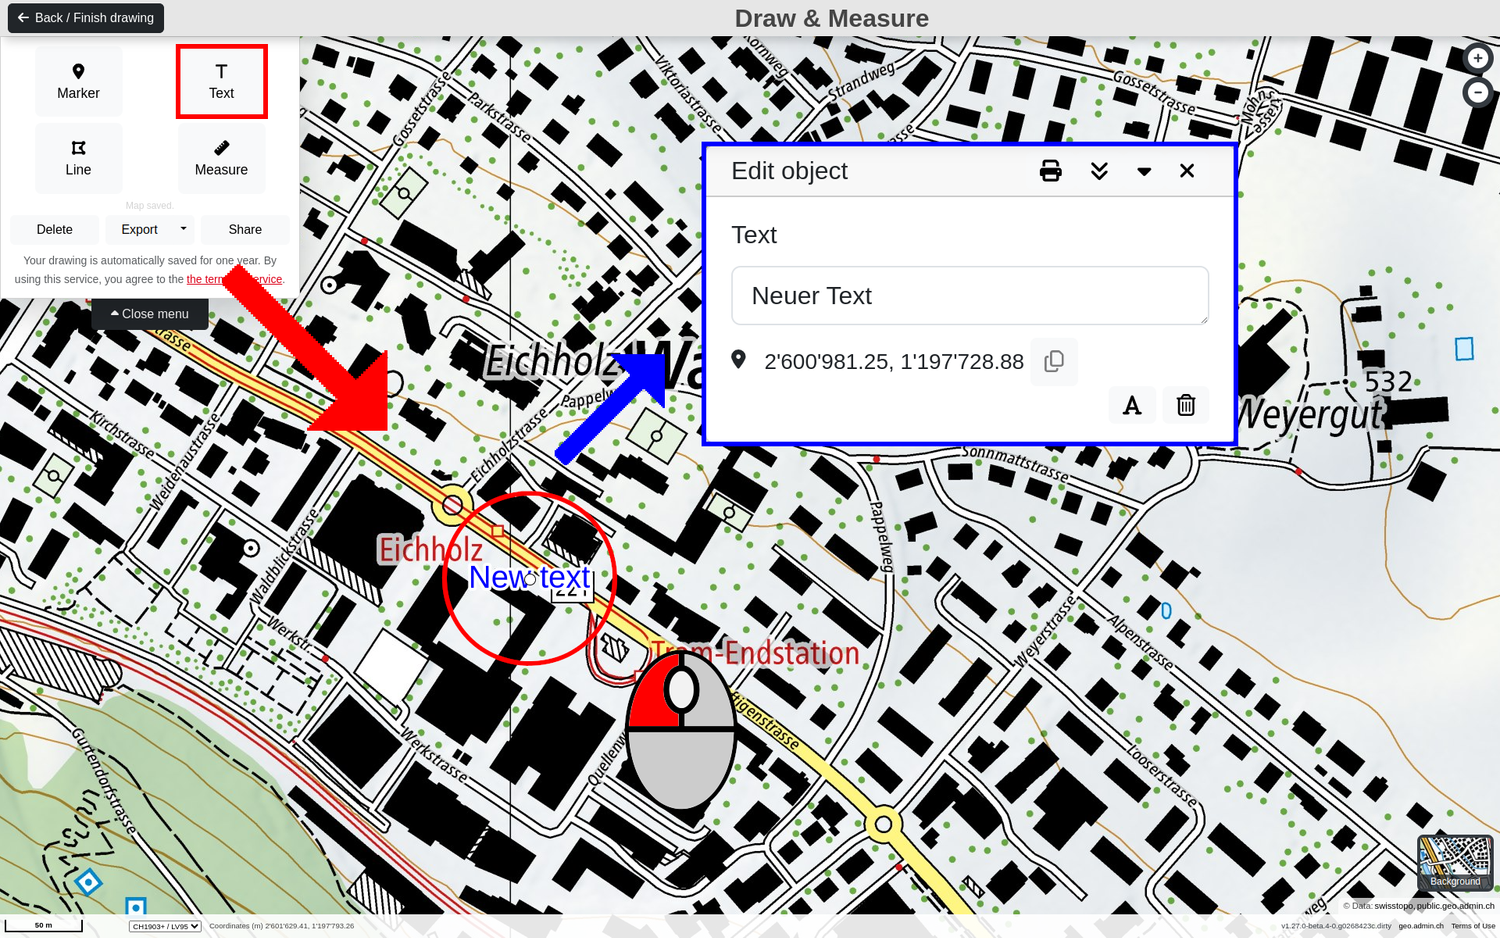
Select the "Text" option to place one (or more) text(s) at the desired location on the map with a mouse click. This step can be repeated for any number of text elements.
Once a text element has been placed, you can adjust the following properties in the associated pop-up window (which can also be arranged in the lower part of the map view using the triangle icon at the top right):
Text: Write the text you want to appear on the card. The size and text colour can be adjusted using the "A" icon at the bottom right of the pop-up. Tip: By entering "Enter" before or after the text, the arrangement of the text on the map can be adjusted using line breaks.
The exact coordinates of the text element are specified below the text in CH1903+/LV95 and can be copied as required.
Delete: The text can be deleted by pressing the "recycle bin" icon at the bottom right.
Select the "Line" option to draw one (or more) line(s) and polygon(s) at desired locations on the map with a mouse click. A self-contained line (with the same start and end points) forms an area object, a polygon. You can place any number of line or polygon vertices on the map until the desired line or polygon object has been completed. Double-click with the left to complete the object creation. This step can be repeated for any number of other line or polygon objects.
In "Draw & Measure" mode, individual line and polygon objects can also be edited at a later date. New vertices can be added or deleted. For each line or polygon object, as for the other drawing elements, a pop-up window appears in which the following properties can be edited:
Description: A longer text describing the object can be entered here. Users of the drawing can view this text as "Object information" by clicking on the object. This input field also supports HTML coded texts. Additional elements can also be added to the description: a link (description and URL), a link to a photo or video. This is done using the three icons on the right above the description field.
The colour of the line or polygon object can be changed using the "Brush" icon at the bottom right.
Delete: The object can be deleted again by pressing the "recycle bin" icon at the bottom right.
Note: For polygons, the area of the object is displayed in the pop-up window below the description text.
When creating or selecting a line or polygon object, the corresponding elevation profile (based on the swisstopo elevation models) is displayed in the lower part of the map window. The following information on the topography along the line/polygon outline can be taken from this:
Height difference from start to finish
Ascent
Descent
Highest point
Lowest point
Distance (as the crow flies) from the start to the end
Distance (effective distance taking into account the topography) from start to finish
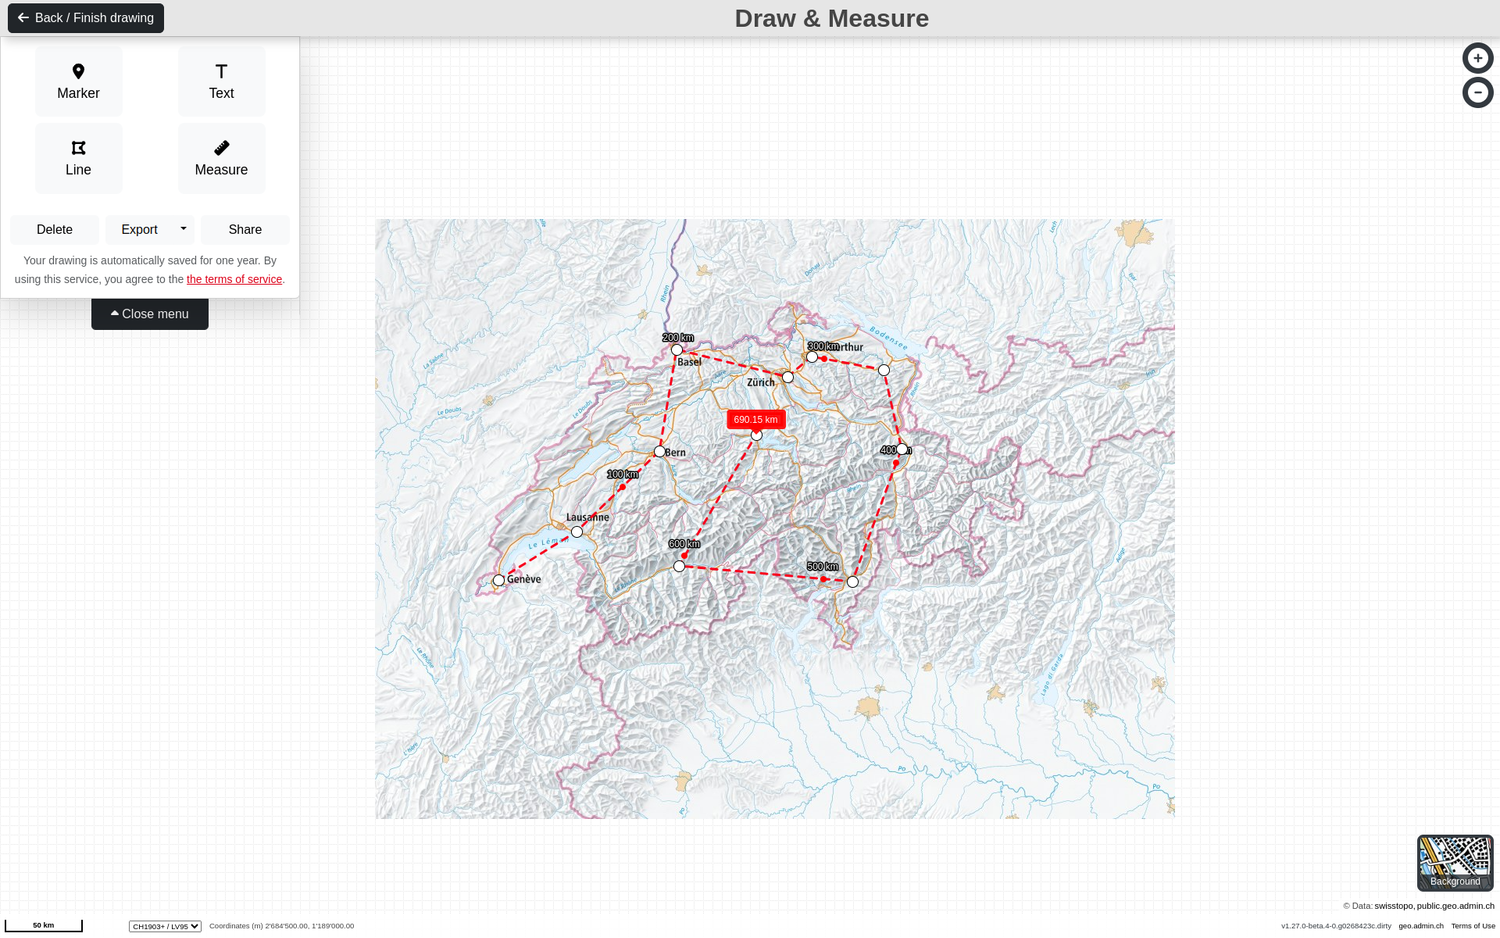
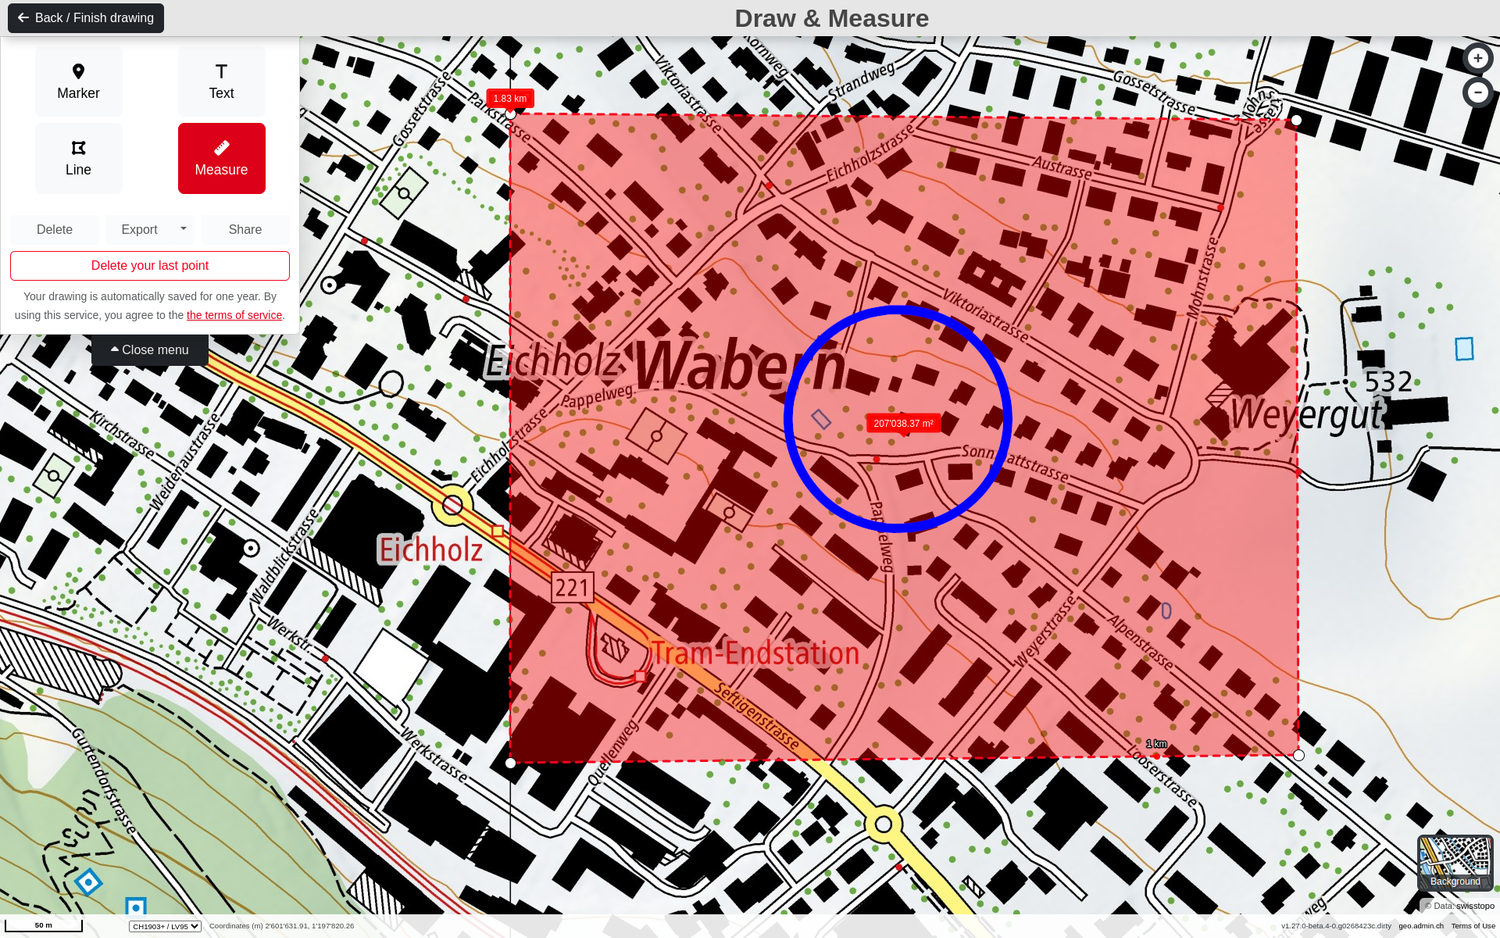
Select the "Measure" option to draw one (or more) line(s) or polygon(s) at the desired locations on the map with a mouse click in order to take specific measurements on the map. This works in the same way as drawing lines or polygons. The following measurement parameters can be determined:
To calculate the azimuth (deviation from north in degrees), a first point must be placed anywhere on the map. The mouse can then simply be moved away from this point in the desired direction on the map. The azimuth and the distance between the click point and the mouse position are displayed directly.
If one or more additional points are recorded after the first one, the distance between/along these points is displayed continuously. As with drawing using the "Line" option, this can be finalised by double-clicking. It can be subsequently adjusted in the same way as when drawing by adding, moving or deleting support points. Note: For longer distances, the intermediate distance information displayed along the line adjusts as you zoom in or out.
To be able to determine an area, a polygon object must be captured on the map using the "Measure" option. As soon as the polygon is closed, the area of the polygon is displayed. Note: An existing line object cannot be converted to an area. A new object to be measured must be created on the map as a polygon (closed line with the same start and end points).
When creating or selecting a line or polygon object, the corresponding elevation profile (based on the swisstopo elevation models) is displayed in the lower part of the map window. The following information on the topography along the line/polygon outline can be taken from this:
Height difference from start to finish
Ascent
Descent
Highest point
Lowest point
Distance (as the crow flies) from the start to the end
Distance (effective distance taking into account the topography) from start to finish
As soon as you have completed your drawing, you can use it as follows:
Drawing name: As already mentioned above, you can give your future KML / GPX file a name other than "Drawing". Attention: You can only change the name after your first edit.
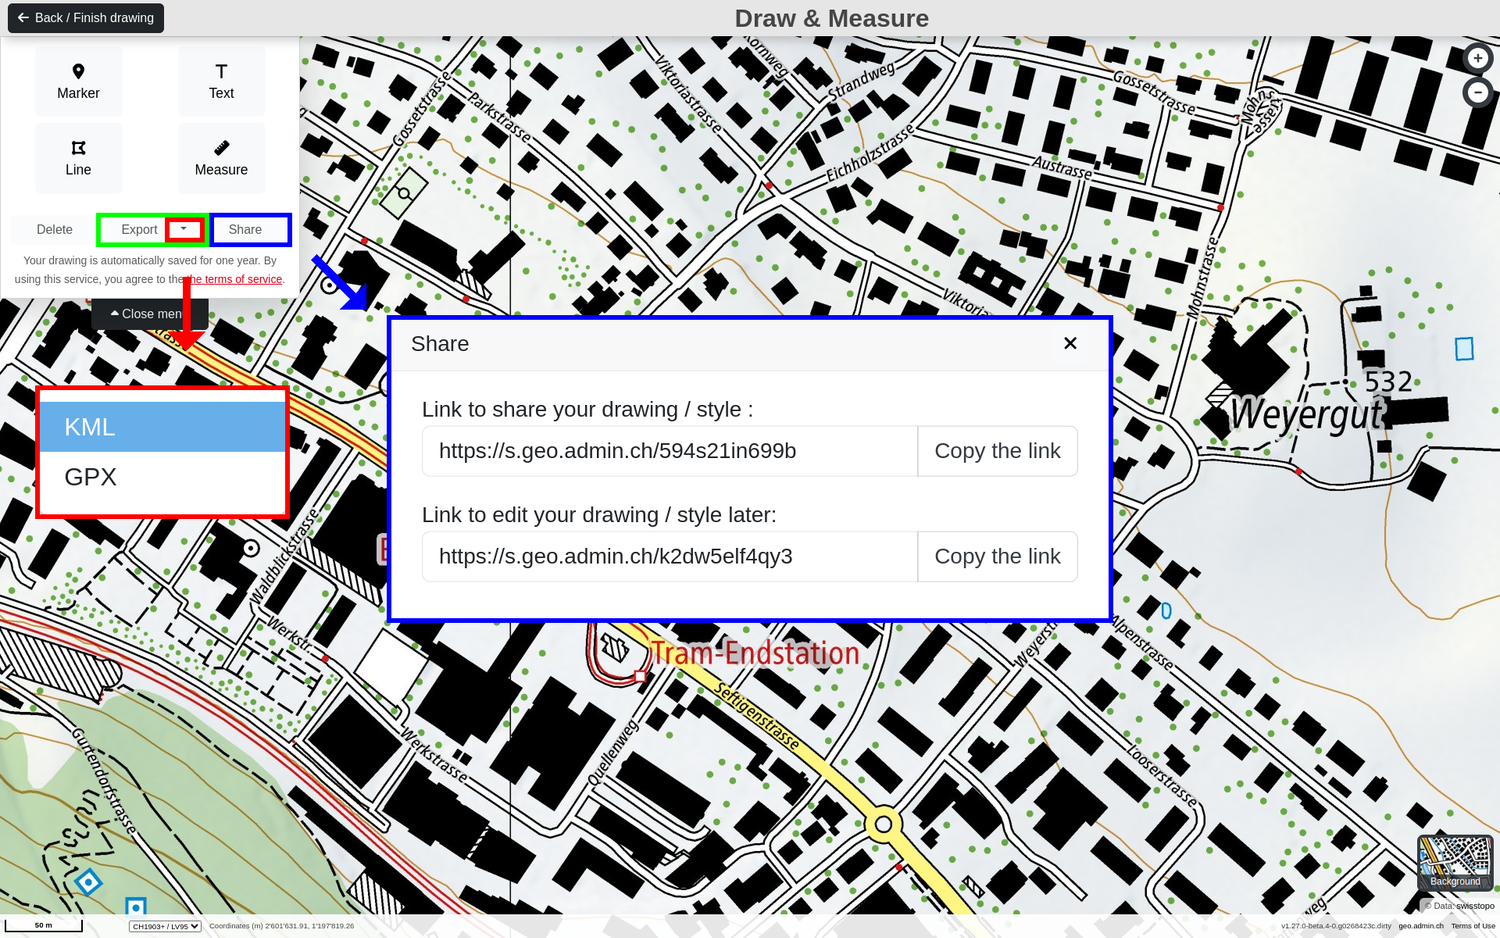
Share: This function creates two links for sharing and editing the drawing Attention: The first link allows you ONLY TO SHARE the drawing The second link allows you to CONTINUE EDITING the drawing. Without this link, you will no longer be able to edit the drawing.
Export: The drawing with all its objects can be exported either as a KML or GPX file.
Delete: Delete all created elements, be it points, texts, lines, polygons or measurements.
When exiting the "Draw & Measure" mode, the drawing remains in the map as a separate layer under "Displayed map". This has the same properties as the other layers and can be downloaded. Attention: As indicated in the general terms of use, the data will remain stored for one year after the last time the drawing was edited.
Attention! Notes regarding the editing of drawings:
New elements or measurements do not automatically generate a second "drawing" map, but are added to the existing one. If you have already imported a KML or GPX file, the new drawings will be generated as a new «Drawing» map under «Displayed maps».
When further processing a drawing via the "Share" link, a new drawing is created in the background, whereby the original drawing remains unchanged Be aware: There will be 2 drawings that are superimposed on each other. If you decide to save the second drawing via the second «Edit» link, only the drawings of the second drawing will be editable and not those of the original drawing.
When further processing a drawing via the "Edit" link, the original drawing is modified. The changes are directly visible via the distributed or linked associated "Share" link. Attention: Save the link carefully. If it is lost, you will no longer be able to edit the original drawing!
If a drawing has been exported as KML / GPX and then reloaded into map.geo.admin.ch using the Import function, it can no longer be edited.